Dividend Yield focused strategies have become increasingly popular among investors seeking to enhance the cashflow and income generated by their portfolio. Much of the interest in this strategy is driven by a lack of sufficient investment opportunities in bond markets. Simply put, bond yields are far too low to warrant meaningful attention from income driven investors.
| It's not all bad news though - the current climate is also punctuated by healthy dividend payouts on a wide range of equity securities. In this post we'll explore a portfolio that has the same level of risk as the S&P 500, but with dividend yield of 14%. This strategy is made possible by the low level of margin loan rates currently available to investors. For example, a 200k account at Interactive Brokers has a loan rate of roughly 1.4%. | "Simply put, bond yields are far too low to warrant meaningful attention from income driven investors." |
Long/Short Portfolio
Typically, a portfolio with such large dividend yield comes with substantial risk. In order to mitigate this risk we'll use both long and short positions. This allows us to hedge out a significant portfion of this risk.
Typically, a portfolio with such large dividend yield comes with substantial risk. In order to mitigate this risk we'll use both long and short positions. This allows us to hedge out a significant portfion of this risk.
We utilize the following assumptions for constructing our portfolio:
- Leverage: No more than 5:1 leverage will be allowed. Note that this level of leverage can only be achieved with a Portfolio Margin account. If you don't have a PM account, see our list of Portfolio Margin brokers to find a suitable broker.
- Min/Max Individual Stock Weighting: no more than 3.5% of the portfolio can be invested in any single stock (anything greater would result in far too much asset-specific risk).
- Portfolio Construction Method: Mean variance optimization is used to ensure the portfolio minimizes risk while maximizing dividend yield. The risk model used in this optimization attributes risk to style and sector factors. This is similar to models available from commercial vendors such as Barra, Northfield and Axioma.
Below you will find an analysis of the long/short portfolio, as well as the composition of the portfolio itself. Figure 1 shows that the portfolio has roughly the same risk as the S&P 500. You can also see how the portfolio compares to other portfolios of interest.
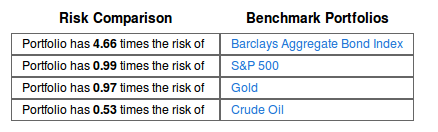 Figure 1. Our Long/Short portfolio has roughly the same level of risk as the S&P 500, which is also about half the risk of a crude oil position. |
Figure 2 shows that there are 168 positions in the portfolio: 92 long and 76 short. The total risk is shown and is also decomposed across the long and short sides. The risk displayed here is quoted as the annualized standard deviation of returns. Note that this risk in the "Longs" and "Shorts" columns is additive. That is, the risk on the long side plus the risk on the short side equals the Risk in the "Total" column. If you look at the "Shorts" column, you will notice that many of the numbers are negative. This tells out the short positions are acting as a hedge to the long positions and therefore reduce risk.
Risk is also attributed to "Common Factor" risk and "Asset Specific" risk. Common Factors drive returns across multiple assets and thus are the source of correlation between securities (think sector/industry risk and the so called "style" factor risk such as value/growth and size). In contrast, asset specific risk emanates from a the operations of an individual company and is diversifiable within limits (i.e. asset specific risk decreases as we add positions to the portfolio). As we can see, Common Factor risk dominates the portfolio at 14.63%, while Asset Specific Risk is 7.74%. To get to the Portfolio Total Risk, we add the square of the Common Factor Risk to the square of the Asset Specific Risk and then take the square root of this number.
Risk is also attributed to "Common Factor" risk and "Asset Specific" risk. Common Factors drive returns across multiple assets and thus are the source of correlation between securities (think sector/industry risk and the so called "style" factor risk such as value/growth and size). In contrast, asset specific risk emanates from a the operations of an individual company and is diversifiable within limits (i.e. asset specific risk decreases as we add positions to the portfolio). As we can see, Common Factor risk dominates the portfolio at 14.63%, while Asset Specific Risk is 7.74%. To get to the Portfolio Total Risk, we add the square of the Common Factor Risk to the square of the Asset Specific Risk and then take the square root of this number.
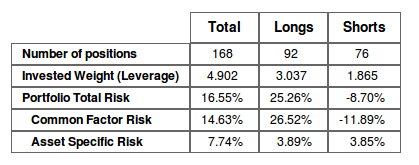 Figure 2. Our Long/Short portfolio utilizes leverage of 4.9 and has an annualized standard deviation of 16.55%. The short side acts as a hedge and thus lowers portfolio risk. |
Figure 3 shows the exposure and risk attributable to the common factors. Focus your attention on the last column which represents the amount of risk contributed by exposure to the given factor. As we can see, most of the risk is driven by exposure to three of the common factors: Utilities Sector factor, Services Sector factor, and the Growth/Value factor. The table also shows that some of the factors act as a hedge and thus end up reducing risk. For example, exposure to the Health Care factor reduces risk by 1.442%
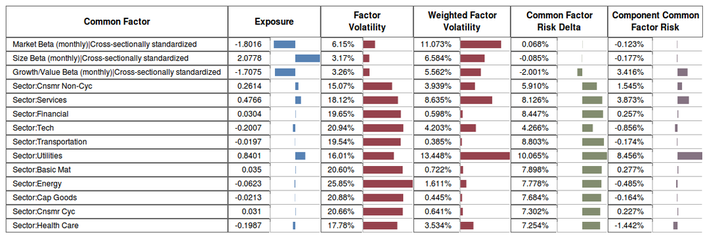
Figure 3. Exposure of our Long/Short portfolio to the various common factors that drive portfolio risk.
Below is a table containing the portfolio's positions assuming a portfolio net equity value of $1,000,000. The share quantity can be scaled up or down to accommodate the actual amount available to be invested. For example, if you only have $100,000 to invest then scale down the positions by a factor of 10.
Most of the columns in the table are self explanatory, however, the "Component Total Risk" deserves further commentary. The Component Total Risk represents the risk emanating from that specific position considering the portfolio context. A positive value means the position adds to risk. A negative value means the position decreases (i.e. hedges out) risk. The sum of these values is equal to the "Portfolio Total Risk" show in Figure 2.
Most of the columns in the table are self explanatory, however, the "Component Total Risk" deserves further commentary. The Component Total Risk represents the risk emanating from that specific position considering the portfolio context. A positive value means the position adds to risk. A negative value means the position decreases (i.e. hedges out) risk. The sum of these values is equal to the "Portfolio Total Risk" show in Figure 2.
Portfolio Composition - Long/Short with 14.3% Dividend Yield
| Ticker | Trade Type | Trade Quantity (# of Shares) | Weight | Component Total Risk | UnWeighted Div Yield | Weighted Div Yield |
|---|---|---|---|---|---|---|
| &CASH | --171677 | -17.17% | 0.00% | 0.00% | 0.00% | |
| ABT | BUY | 543 | 3.50% | 0.25% | 3.17% | 0.11% |
| ADBE | SELL | 1048 | -3.50% | -0.10% | 0.00% | 0.00% |
| ADSK | SELL | 1101 | -3.50% | -0.03% | 0.00% | 0.00% |
| AEE | BUY | 1226 | 3.50% | 0.36% | 5.57% | 0.20% |
| AEP | BUY | 853 | 3.50% | 0.38% | 4.59% | 0.16% |
| AIG | SELL | 237 | -0.78% | -0.05% | 0.00% | 0.00% |
| AIV | BUY | 217 | 0.54% | 0.04% | 3.10% | 0.02% |
| AKAM | SELL | 524 | -1.88% | -0.05% | 0.00% | 0.00% |
| ALXN | SELL | 370 | -3.50% | -0.13% | 0.00% | 0.00% |
| AMD | SELL | 6219 | -1.21% | 0.05% | 0.00% | 0.00% |
| AMZN | SELL | 47 | -1.13% | -0.07% | 0.00% | 0.00% |
| AN | SELL | 832 | -3.50% | -0.25% | 0.00% | 0.00% |
| APOL | SELL | 73 | -0.14% | -0.01% | 0.00% | 0.00% |
| AVP | BUY | 2454 | 3.50% | 0.21% | 5.37% | 0.19% |
| BBBY | SELL | 582 | -3.50% | -0.11% | 0.00% | 0.00% |
| BBY | BUY | 2991 | 3.50% | 0.35% | 5.62% | 0.20% |
| BIG | SELL | 775 | -2.21% | -0.12% | 0.00% | 0.00% |
| BIIB | SELL | 234 | -3.51% | -0.20% | 0.00% | 0.00% |
| BMY | BUY | 1073 | 3.50% | 0.30% | 4.20% | 0.15% |
| BRK-B | SELL | 395 | -3.50% | -0.28% | 0.00% | 0.00% |
| BSX | SELL | 6261 | -3.50% | -0.17% | 0.00% | 0.00% |
| BWA | SELL | 76 | -0.50% | -0.02% | 0.00% | 0.00% |
| C | SELL | 971 | -3.50% | -0.26% | 0.11% | 0.00% |
| CA | BUY | 1584 | 3.50% | 0.07% | 4.57% | 0.16% |
| CAM | SELL | 643 | -3.50% | -0.18% | 0.00% | 0.00% |
| CBG | SELL | 1959 | -3.50% | -0.20% | 0.00% | 0.00% |
| CCI | SELL | 518 | -3.50% | -0.25% | 0.00% | 0.00% |
| CELG | SELL | 164 | -1.29% | -0.07% | 0.00% | 0.00% |
| CERN | SELL | 121 | -0.95% | -0.02% | 0.00% | 0.00% |
| CFN | SELL | 1248 | -3.50% | -0.19% | 0.00% | 0.00% |
| CINF | BUY | 868 | 3.50% | 0.29% | 4.05% | 0.14% |
| CLF | BUY | 1121 | 3.50% | 0.36% | 6.96% | 0.24% |
| CME | BUY | 641 | 3.50% | 0.23% | 4.08% | 0.14% |
| CMG | SELL | 98 | -2.69% | -0.06% | 0.00% | 0.00% |
| CMS | BUY | 1488 | 3.50% | 0.35% | 4.08% | 0.14% |
| CNP | BUY | 1817 | 3.50% | 0.36% | 4.21% | 0.15% |
| COP | BUY | 618 | 3.50% | 0.29% | 4.66% | 0.16% |
| CRM | SELL | 61 | -0.97% | 0.01% | 0.00% | 0.00% |
| CTL | BUY | 909 | 3.50% | 0.27% | 7.67% | 0.27% |
| CTSH | SELL | 395 | -2.63% | -0.07% | 0.00% | 0.00% |
| CTXS | SELL | 259 | -1.60% | -0.01% | 0.00% | 0.00% |
| CVC | BUY | 2504 | 3.50% | 0.44% | 4.27% | 0.15% |
| CVX | BUY | 332 | 3.50% | 0.30% | 3.37% | 0.12% |
| D | BUY | 698 | 3.50% | 0.35% | 4.14% | 0.14% |
| DD | BUY | 812 | 3.50% | 0.24% | 4.01% | 0.14% |
| DF | SELL | 285 | -0.48% | -0.02% | 0.00% | 0.00% |
| DLTR | SELL | 833 | -3.50% | -0.14% | 0.00% | 0.00% |
| DNR | SELL | 2224 | -3.50% | -0.19% | 0.00% | 0.00% |
| DO | BUY | 520 | 3.50% | 0.26% | 5.25% | 0.18% |
| DOW | BUY | 1191 | 3.50% | 0.28% | 3.96% | 0.14% |
| DPS | BUY | 781 | 3.50% | 0.21% | 3.04% | 0.11% |
| DRI | BUY | 654 | 3.50% | 0.25% | 3.54% | 0.12% |
| DTE | BUY | 594 | 3.50% | 0.36% | 4.04% | 0.14% |
| DUK | BUY | 579 | 3.50% | 0.36% | 5.01% | 0.18% |
| DVA | SELL | 281 | -3.13% | -0.23% | 0.00% | 0.00% |
| ED | BUY | 647 | 3.50% | 0.35% | 4.46% | 0.16% |
| EL | SELL | 587 | -3.50% | -0.14% | 0.00% | 0.00% |
| EMC | SELL | 1411 | -3.50% | -0.02% | 0.00% | 0.00% |
| ETFC | SELL | 4300 | -3.50% | -0.18% | 0.00% | 0.00% |
| ETR | BUY | 564 | 3.50% | 0.38% | 5.33% | 0.19% |
| EXC | BUY | 1225 | 3.50% | 0.36% | 7.28% | 0.25% |
| FE | BUY | 852 | 3.50% | 0.34% | 5.34% | 0.19% |
| FFIV | SELL | 323 | -2.98% | 0.03% | 0.00% | 0.00% |
| FISV | SELL | 464 | -3.50% | -0.13% | 0.00% | 0.00% |
| FMC | SELL | 639 | -3.50% | -0.22% | 0.64% | -0.02% |
| FRX | SELL | 1050 | -3.50% | -0.21% | 0.00% | 0.00% |
| FSLR | SELL | 289 | -0.71% | -0.04% | 0.00% | 0.00% |
| FTI | SELL | 838 | -3.50% | -0.21% | 0.00% | 0.00% |
| FTR | BUY | 7795 | 3.50% | 0.43% | 8.91% | 0.31% |
| GAS | BUY | 932 | 3.50% | 0.36% | 4.88% | 0.17% |
| GCI | BUY | 1963 | 3.50% | 0.36% | 3.87% | 0.14% |
| GILD | SELL | 270 | -2.06% | -0.12% | 0.00% | 0.00% |
| GIS | BUY | 2 | 0.01% | 0.00% | 3.14% | 0.00% |
| GNW | SELL | 5641 | -3.19% | -0.20% | 0.00% | 0.00% |
| GOOG | SELL | 4 | -0.27% | -0.01% | 0.00% | 0.00% |
| GT | SELL | 2188 | -2.59% | -0.18% | 0.00% | 0.00% |
| HAS | BUY | 561 | 2.15% | 0.12% | 3.66% | 0.08% |
| HCBK | BUY | 4289 | 3.50% | 0.38% | 3.99% | 0.14% |
| HCN | BUY | 581 | 3.50% | 0.31% | 4.94% | 0.17% |
| HCP | BUY | 766 | 3.50% | 0.31% | 4.41% | 0.15% |
| HNZ | BUY | 599 | 3.50% | 0.22% | 3.45% | 0.12% |
| HPQ | BUY | 2814 | 3.50% | 0.13% | 4.22% | 0.15% |
| HRB | BUY | 1920 | 3.50% | 0.33% | 4.45% | 0.16% |
| HSP | SELL | 815 | -2.40% | -0.13% | 0.00% | 0.00% |
| INTC | BUY | 1775 | 3.50% | 0.13% | 4.49% | 0.16% |
| ISRG | SELL | 12 | -0.65% | -0.04% | 0.00% | 0.00% |
| JDSU | SELL | 2025 | -2.36% | 0.00% | 0.00% | 0.00% |
| JNJ | BUY | 503 | 3.50% | 0.28% | 3.48% | 0.12% |
| K | BUY | 633 | 3.50% | 0.21% | 3.14% | 0.11% |
| KIM | BUY | 1826 | 3.50% | 0.27% | 4.00% | 0.14% |
| KLAC | BUY | 775 | 3.50% | 0.15% | 3.40% | 0.12% |
| KMX | SELL | 32 | -0.11% | -0.01% | 0.00% | 0.00% |
| LEG | BUY | 1276 | 3.50% | 0.31% | 4.19% | 0.15% |
| LH | SELL | 105 | -0.88% | -0.06% | 0.00% | 0.00% |
| LIFE | SELL | 699 | -3.50% | -0.21% | 0.00% | 0.00% |
| LLTC | BUY | 362 | 1.18% | 0.04% | 3.13% | 0.04% |
| LLY | BUY | 733 | 3.50% | 0.31% | 4.13% | 0.14% |
| LMT | BUY | 381 | 3.50% | 0.26% | 4.42% | 0.15% |
| LO | BUY | 284 | 3.50% | 0.19% | 4.90% | 0.17% |
| LRCX | SELL | 990 | -3.50% | -0.09% | 0.00% | 0.00% |
| LSI | SELL | 5216 | -3.50% | 0.03% | 0.00% | 0.00% |
| LUV | SELL | 2103 | -1.97% | -0.16% | 0.33% | -0.01% |
| MCD | BUY | 402 | 3.50% | 0.28% | 3.26% | 0.11% |
| MCHP | BUY | 1167 | 3.50% | 0.15% | 4.77% | 0.17% |
| MNST | SELL | 402 | -1.85% | -0.02% | 0.00% | 0.00% |
| MO | BUY | 1045 | 3.50% | 0.20% | 5.08% | 0.18% |
| MU | SELL | 6162 | -3.50% | -0.07% | 0.00% | 0.00% |
| MUR | BUY | 599 | 3.50% | 0.35% | 6.39% | 0.22% |
| MYL | SELL | 705 | -1.91% | -0.12% | 0.00% | 0.00% |
| NBR | SELL | 2496 | -3.50% | -0.22% | 0.00% | 0.00% |
| NOC | BUY | 535 | 3.50% | 0.30% | 3.31% | 0.12% |
| NU | BUY | 928 | 3.50% | 0.35% | 3.31% | 0.12% |
| NUE | BUY | 851 | 3.50% | 0.30% | 3.59% | 0.13% |
| NYX | BUY | 1530 | 3.50% | 0.30% | 5.28% | 0.18% |
| OI | SELL | 1769 | -3.50% | -0.22% | 0.00% | 0.00% |
| PAYX | BUY | 1079 | 3.50% | 0.28% | 4.01% | 0.14% |
| PBCT | BUY | 2941 | 3.50% | 0.32% | 5.46% | 0.19% |
| PBI | BUY | 3133 | 3.50% | 0.24% | 13.43% | 0.47% |
| PCAR | BUY | 126 | 0.54% | 0.04% | 3.48% | 0.02% |
| PCG | BUY | 871 | 3.50% | 0.35% | 4.54% | 0.16% |
| PCL | BUY | 833 | 3.50% | 0.30% | 4.02% | 0.14% |
| PCLN | SELL | 21 | -1.35% | -0.05% | 0.00% | 0.00% |
| PCP | SELL | 195 | -3.50% | -0.27% | 0.07% | 0.00% |
| PEG | BUY | 1197 | 3.50% | 0.36% | 4.79% | 0.17% |
| PEP | BUY | 89 | 0.62% | 0.04% | 3.04% | 0.02% |
| PFE | BUY | 1427 | 3.50% | 0.28% | 3.61% | 0.13% |
| PHM | SELL | 2055 | -3.50% | -0.22% | 0.00% | 0.00% |
| PLD | BUY | 383 | 1.31% | 0.09% | 3.30% | 0.04% |
| PM | BUY | 387 | 3.50% | 0.19% | 3.56% | 0.12% |
| PNW | BUY | 710 | 3.50% | 0.35% | 4.28% | 0.15% |
| POM | BUY | 1832 | 3.50% | 0.37% | 5.66% | 0.20% |
| PPL | BUY | 1246 | 3.50% | 0.35% | 5.07% | 0.18% |
| PXD | SELL | 324 | -3.50% | -0.18% | 0.08% | 0.00% |
| RAI | BUY | 812 | 3.50% | 0.22% | 5.40% | 0.19% |
| RDC | SELL | 451 | -1.49% | -0.09% | 0.00% | 0.00% |
| RHT | SELL | 267 | -1.33% | 0.00% | 0.00% | 0.00% |
| RRD | BUY | 3673 | 3.50% | 0.38% | 10.91% | 0.38% |
| SCG | BUY | 776 | 3.50% | 0.35% | 4.35% | 0.15% |
| SE | BUY | 1246 | 3.50% | 0.35% | 4.11% | 0.14% |
| SNDK | SELL | 174 | -0.70% | -0.04% | 0.00% | 0.00% |
| SO | BUY | 833 | 3.50% | 0.35% | 4.60% | 0.16% |
| SPLS | BUY | 2888 | 3.44% | 0.24% | 3.64% | 0.13% |
| SRCL | SELL | 380 | -3.50% | -0.25% | 0.00% | 0.00% |
| STX | BUY | 1218 | 3.33% | 0.12% | 4.26% | 0.14% |
| STZ | SELL | 30 | -0.10% | -0.01% | 0.00% | 0.00% |
| SWY | BUY | 2064 | 3.50% | 0.28% | 3.89% | 0.14% |
| SYY | BUY | 1129 | 3.50% | 0.29% | 3.54% | 0.12% |
| T | BUY | 1019 | 3.50% | 0.28% | 5.20% | 0.18% |
| TE | BUY | 2159 | 3.50% | 0.37% | 5.40% | 0.19% |
| TEG | BUY | 665 | 3.50% | 0.36% | 5.17% | 0.18% |
| TER | SELL | 2197 | -3.50% | -0.05% | 0.00% | 0.00% |
| TSO | SELL | 299 | -1.25% | -0.07% | 0.29% | 0.00% |
| TYC | SELL | 1265 | -3.50% | -0.21% | 0.00% | 0.00% |
| URBN | SELL | 444 | -1.68% | -0.09% | 0.00% | 0.00% |
| VAR | SELL | 79 | -0.55% | -0.04% | 0.00% | 0.00% |
| VMC | SELL | 432 | -2.13% | -0.15% | 0.08% | 0.00% |
| VNO | BUY | 1375 | 3.50% | 0.26% | 3.69% | 0.13% |
| VTR | BUY | 538 | 3.50% | 0.30% | 3.79% | 0.13% |
| VZ | BUY | 800 | 3.50% | 0.32% | 4.67% | 0.16% |
| WAT | SELL | 418 | -3.50% | -0.06% | 0.00% | 0.00% |
| WIN | BUY | 4207 | 3.50% | 0.32% | 12.02% | 0.42% |
| WM | BUY | 1082 | 3.50% | 0.27% | 4.38% | 0.15% |
| WMB | BUY | 1047 | 3.50% | 0.26% | 3.89% | 0.14% |
| WPI | SELL | 407 | -3.50% | -0.22% | 0.00% | 0.00% |
| WPX | SELL | 2116 | -3.50% | -0.24% | 0.00% | 0.00% |
| WYNN | SELL | 82 | -0.90% | -0.06% | 0.00% | 0.00% |
| XEL | BUY | 1345 | 3.50% | 0.36% | 4.06% | 0.14% |
| XLNX | BUY | 1024 | 3.50% | 0.12% | 2.52% | 0.09% |
| TOTAL: | 100.00% | 16.61% | 14.32% |
 RSS Feed