How Portfolio Margin Works
Intro
All portfolio margin investors should attain a basic understanding of how portfolio margin calculations work. This is no easy task as understanding the methodology can be a challenge for even the most seasoned investor. This article attempts to demystify the mechanics of portfolio margin. |
The specific calculations for determining portfolio margin are mandated by the Securities & Exchange Commission. There is a degree of standardization across brokers. Under the regulations, brokers are required to compute portfolio margin according to a methodology called TIMS (Theoretical Intermarket Margining System). While several brokers have been granted permission to augment TIMS with their own in-house customizations, TIMS still provides the baseline used by all brokers.
The mechanics of TIMS may seem dauntingly complex to those not familiar with portfolio risk systems. Yet, for those acquainted with these systems, TIMS may seem unfamiliar. TIMS is both a risk and rules based methodology (it's probably best described as "rules that are informed by risk considerations"). Underpinning the methodology is the idea that margin should be set to the maximum loss the portfolio would incur under adverse market scenarios. The TIMS methodology defines what adverse scenarios to explore, how correlated securities behave under said scenarios, and how P&Ls (profit/loss) for groups of securities roll-up to a total P&L for the portfolio
The mechanics of TIMS may seem dauntingly complex to those not familiar with portfolio risk systems. Yet, for those acquainted with these systems, TIMS may seem unfamiliar. TIMS is both a risk and rules based methodology (it's probably best described as "rules that are informed by risk considerations"). Underpinning the methodology is the idea that margin should be set to the maximum loss the portfolio would incur under adverse market scenarios. The TIMS methodology defines what adverse scenarios to explore, how correlated securities behave under said scenarios, and how P&Ls (profit/loss) for groups of securities roll-up to a total P&L for the portfolio
|
Scenarios and Stressing
The scenarios explored by TIMS involve stressing the underlying security price across a range of percentage returns. The word "underlying" refers to the stock, ETF or index that an option or futures is written against. If the portfolio does not contain any derivatives than the "underlying" is simply the stock itself. The size of the return applied to the underlying depends on the type of security in question. For this, securities are grouped into three categories:
Leveraged and inverse ETFs are stressed by the moves stated above scaled by the ETFs leverage. The underlying price is evaluated at 10 equidistant intervals within a range: 5 intervals on the positive side and 5 intervals on the negative side. |
|
Let's look at an example to illustrate how this works. Say we have a portfolio containing 100 shares of Apple Inc. (ticker AAPL) trading at $400 per share. AAPL will be stressed along the range of -15% to 15% from it's current price since AAPL is a stock and therefore fits into the last category described above. The following table shows the percentage returns and the resulting scenario price.
| Stressed Stock Move | -15% | -12% | -9% | -6% | -3% | -0% | -3% | 6% | 9% | 12% | 15% |
| Scenario Price | $340 | $352 | $364 | $376 | $388 | $400 | $412 | $424 | $436 | $448 | $460 |
Again, the size of the market move range depends on the type of underlying. Well diversified indexes tend to undergo a smaller range of market moves than less diversified indexes or individual stocks.
Valuation of Class Groups
Within the portfolio, each underlying and it's associated options are organized into groups and valued under the above scenarios. In portfolio margin vernacular, these groups are known as "Class Groups". Let's look at a couple examples.
Within the portfolio, each underlying and it's associated options are organized into groups and valued under the above scenarios. In portfolio margin vernacular, these groups are known as "Class Groups". Let's look at a couple examples.
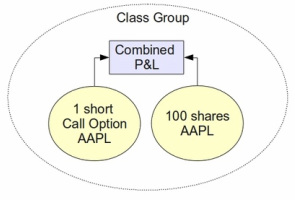
Figure 1. A class group consists of all the options and futures on a given underlying as well as the underlying itself. These are valued together under the stress scenarios. In this example we show a covered call option on Apple.
|
Say we had a AAPL covered call option position (i.e. long stock, short call option) in our portfolio. Both the call option and the underlying stock would fall into one "Class Group" and would be valued together to determine the combined P&L under each scenario. The situation is visualized in the flowchart to the left.
Further, let's say our portfolio held an option straddle position but on a different underlying than that of our AAPL covered call. In this case, the straddle would be in a different Class Group. This Class Group would be valued under the stressed scenarios and the resulting P&Ls would be held separately from the AAPL covered call P&Ls. At the conclusion of this step we will have multiple Class Groups, each having its own table of scenario P&Ls. |
P&L Offsets
Underlyings that are highly correlated will have their Class Group P&Ls partially netted against each other. In other words, under each stress scenario the profit from one Class Group will partially offsets the loss to another group. The amount that a profit from one group can offset the loss to a different group varies according to a table of predetermined percentages. Some Class Groups are allowed P&L offsets as high 90%, while other Class Groups obtain no offset whatsoever.
While these offset percentages were originally based on historical correlations between securities, they are now set in stone and do not update regardless of more recent correlation trends. Offsets tend to be very conservative. For example, the offset allowed for Class Groups with individual stocks as the underlying is 0% (even though certain stocks may be exhibit high correlated). In other words, the profit from one stock is not allowed to offset the loss to another stock.
So, what exactly does this table of offset percentages look like?
|
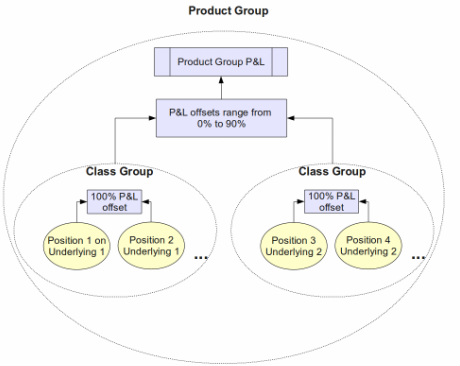
To answer this question we first need to introduce another piece of portfolio margin terminology: "Product Group". A Product Group is a set of Class Groups that have highly correlated underlyings. The situation can be visualized in Figure 2 to the right where two Class Groups fit into one Product Group.
Examples of product groups and their offsets are:
|
|
To see how this works, say we had a long S&P 500 position and a short Russell 1000 position. (The exact securities used here could be ETFs such as long SPY and short IWB.) Under the scenario where both indexes drop by 8%, the profit on the Russell 1000 short can offset the loss on the S&P 500 long to the tune of 90% of the profit (i.e. short position profit * 0.90). This is so because they both fall into the Broad-Based Index Product Group.
Portfolio Groups
Once the Product Group P&Ls are netted against each other there will be one additional layer of P&L offsets. Product Groups are further grouped into "Portfolio Groups". Currently, there is only one Portfolio Group and it consists of the following Product Groups: Broad-Based Indexes, NASD Market Indexes, and Small Cap Indexes. The P&L offset for Product Groups within this Portfolio Group is 50%.
For example, if had a long S&P 500 position and a short NASDAQ 100 position (such as the QQQ ETF), the loss on a S&P 500 long would offset the profit on the NASDAQ 100 short to the tune of 50% of the profit.
Margin
After all P&Ls and offsets have been computed and rolled-up, the margin is determined by finding the maximum net loss across all the scenarios examined. Recall that in the world of portfolio margin, there is no difference between initial and maintenance margin. Therefore, the margin requirement under portfolio margin is simply the single largest loss value.
After all P&Ls and offsets have been computed and rolled-up, the margin is determined by finding the maximum net loss across all the scenarios examined. Recall that in the world of portfolio margin, there is no difference between initial and maintenance margin. Therefore, the margin requirement under portfolio margin is simply the single largest loss value.
Contract Minimums
In some cases, a portfolio may be hedged to such a precise extent that the maximum net loss determined using the above procedure results in an incredibly small margin requirement. To prevent this situation, the methodology imposes a per contract minimum which is $37.50 for most options contracts.
In some cases, a portfolio may be hedged to such a precise extent that the maximum net loss determined using the above procedure results in an incredibly small margin requirement. To prevent this situation, the methodology imposes a per contract minimum which is $37.50 for most options contracts.
Summary
Let's recap the process from start to finish:
Let's recap the process from start to finish:
|
Final Word
The analysis presented in this article is for TIMS: the baseline methodology used by all brokers. Individual brokers will often augment the TIMS methodology with their own in house customizations. These customizations usually include stressing the volatility used to price the options, penalties for portfolios with large single concentrations, and special handling of low cap, OTC, and pink sheet stocks.
The analysis presented in this article is for TIMS: the baseline methodology used by all brokers. Individual brokers will often augment the TIMS methodology with their own in house customizations. These customizations usually include stressing the volatility used to price the options, penalties for portfolios with large single concentrations, and special handling of low cap, OTC, and pink sheet stocks.