• Home
  • Tutorials
    • Intro to Margin Accounts
    • Portfolio Margin 101
    • How Portfolio Margin Works
  • Resources
    • Option Strategies - Reg T Margin
    • Option Strategies - Portfolio Margin
    • Margin Calculators for Options
    • Regulatory Timeline
    • Stress Test Market Moves
    • P&L Offsets
    • Brokers Offering Portfolio Margin
    • Margin Rate Comparison
  • FAQs
  • About Us
    • Disclaimer
  • Blog
The Margin Investor

Mergers and Acquisitions - What's the news saying?

11/9/2012

0 Comments

 
Apropos of my previous blog post discussing quantifying news stories, I present an additional news metric that provides food for thought.

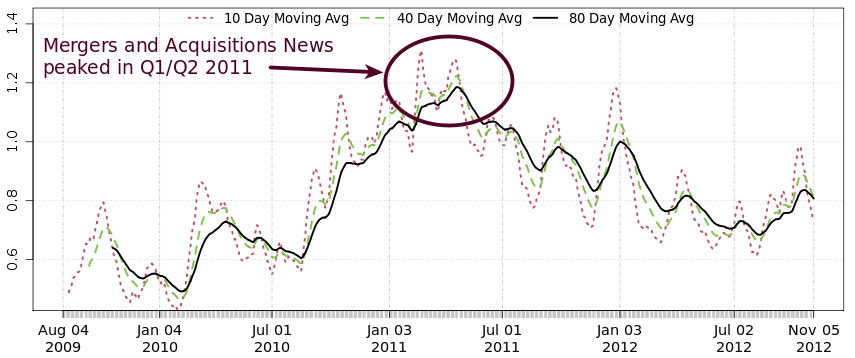
The graph below represents M&A news chatter activity through time, with the Y-axis representing M&A news as a percentage of the overall news flow. The graph shows that M&A news peaked in Q1/Q2 2011 (at around 1.3%) and has been declining ever since.
News articles for S&P 500 stocks: M&A News 
(percent of overall news flow)
Mergers and Acquisitions News
0 Comments

Your comment will be posted after it is approved.


Leave a Reply.

    Author

    Jason Apolee is a contributing editor to The Margin Investor where he focuses on news commentary and evaluating broker offerings.

    RSS Feed

    Archives

    November 2013
    February 2013
    January 2013
    November 2012
    July 2012
    May 2012
    January 2012
    December 2011
    November 2011

    Categories

    All
    Academic Papers
    Bonds
    Brokers
    Buy-write
    Capital Gains
    Covered Call
    Discount Brokers
    Dividend Yield
    Earnings
    Financial Crises 2008
    Hedging
    High Yield
    Indexes
    Leverage
    M&A
    Margin Rates
    News Info
    Portfolio Risk
    Recession
    Stock Concentration
    Strategy Based Margin
    Systematic Margin Risk
    Taxes
    Trading
    Trading Strategies
    Videos

Powered by Create your own unique website with customizable templates.
Photos from neurmadic aesthetic, DonkeyHotey