• Home
  • Tutorials
    • Intro to Margin Accounts
    • Portfolio Margin 101
    • How Portfolio Margin Works
  • Resources
    • Option Strategies - Reg T Margin
    • Option Strategies - Portfolio Margin
    • Margin Calculators for Options
    • Regulatory Timeline
    • Stress Test Market Moves
    • P&L Offsets
    • Brokers Offering Portfolio Margin
    • Margin Rate Comparison
  • FAQs
  • About Us
    • Disclaimer
  • Blog
The Margin Investor

Compiling Margin Rate data from online Brokers

11/28/2012

7 Comments

 
I've spent a lot of time talking about the margin rates offered by various on-line brokers and the impact it can have on a trading strategy. Unfortunately, I have yet to find a decent comparison of margin rates across various brokers. While a handful of sites compile this data they are almost always lacking in some critical way (updated infrequently or incomplete in their list of brokers). 

So, I've created a new page on The Margin Investor site with an updated comparison of broker margin rates. 

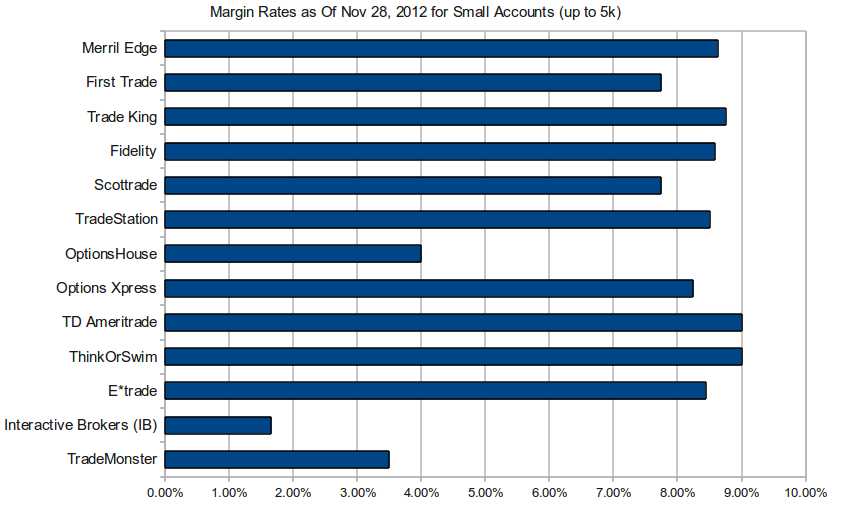
The chart below illustrates margin rates for a small brokerage account. It continues to surprise me just how how much variability there is between different brokers. 
See here for the full list.
Picture
7 Comments

14% Div Yield Portfolio - Same risk as S&P 500

11/26/2012

9 Comments

 
Dividend Yield focused strategies have become increasingly popular among investors seeking to enhance the cashflow and income generated by their portfolio. Much of the interest in this strategy is driven by a lack of sufficient investment opportunities in bond markets. Simply put, bond yields are far too low to warrant meaningful attention from income driven investors. 
It's not all bad news though - the current climate is also punctuated by healthy dividend payouts on a wide range of equity securities. 

In this post we'll explore a portfolio that has the same level of risk as the S&P 500, but with dividend yield of 14%. This strategy is made possible by the low level of margin loan rates currently available to investors. For example, a 200k account at Interactive Brokers has a loan rate of roughly 1.4%.

"Simply put, bond yields are far too low to warrant meaningful attention from income driven investors."
Long/Short Portfolio
Typically, a portfolio with such large dividend yield comes with substantial risk. In order to mitigate this risk we'll use both long and short positions. This allows us to hedge out a significant portfion of this risk. 
We utilize the following assumptions for constructing our portfolio:
  • Leverage: No more than 5:1 leverage will be allowed. Note that this level of leverage can only be achieved with a Portfolio Margin account. If you don't have a PM account, see our list of Portfolio Margin brokers to find a suitable broker.
  • Min/Max Individual Stock Weighting: no more than 3.5% of the portfolio can be invested in any single stock (anything greater would result in far too much asset-specific risk).
  • Portfolio Construction Method: Mean variance optimization is used to ensure the portfolio minimizes risk while maximizing dividend yield. The risk model used in this optimization attributes risk to style and sector factors. This is similar to models available from commercial vendors such as Barra, Northfield and Axioma.
Below you will find an analysis of the long/short portfolio, as well as the composition of the portfolio itself. Figure 1 shows that the portfolio has roughly the same risk as the S&P 500. You can also see how the portfolio compares to other portfolios of interest.
Risk Comparison
Figure 1. Our Long/Short portfolio has roughly the same level of risk as the S&P 500, which is also about half the risk of a crude oil position.
Figure 2 shows that there are 168 positions in the portfolio: 92 long and 76 short. The total risk is shown and is also decomposed across the long and short sides. The risk displayed here is quoted as the annualized standard deviation of returns. Note that this risk in the "Longs" and "Shorts" columns is additive. That is, the risk on the long side plus the risk on the short side equals the Risk in the "Total" column. If you look at the "Shorts" column, you will notice that many of the numbers are negative. This tells out the short positions are acting as a hedge to the long positions and therefore reduce risk.   

Risk is also attributed to "Common Factor" risk and "Asset Specific" risk. Common Factors drive returns across multiple assets and thus are the source of correlation between securities (think sector/industry risk and the so called "style" factor risk such as value/growth and size). In contrast, asset specific risk emanates from a the operations of an individual company and is diversifiable within limits (i.e. asset specific risk decreases as we add positions to the portfolio). As we can see, Common Factor risk dominates the portfolio at 14.63%, while Asset Specific Risk is 7.74%. To get to the Portfolio Total Risk, we add the square of the Common Factor Risk to the square of the Asset Specific Risk and then take the square root of this number.
Risk Breakdown
Figure 2. Our Long/Short portfolio utilizes leverage of 4.9 and has an annualized standard deviation of 16.55%. The short side acts as a hedge and thus lowers portfolio risk.
Figure 3 shows the exposure and risk attributable to the common factors. Focus your attention on the last column which represents the amount of risk contributed by exposure to the given factor. As we can see, most of the risk is driven by exposure to three of the common factors: Utilities Sector factor, Services Sector factor, and the Growth/Value factor. The table also shows that some of the factors act as a hedge and thus end up reducing risk. For example, exposure to the Health Care factor reduces risk by 1.442%
Risk Breakdown
Figure 3. Exposure of our Long/Short portfolio to the various common factors that drive portfolio risk.
Below is a table containing the portfolio's positions assuming a portfolio net equity value of $1,000,000. The share quantity can be scaled up or down to accommodate the actual amount available to be invested. For example, if you only have $100,000 to invest then scale down the positions by a factor of 10. 

Most of the columns in the table are self explanatory, however, the "Component Total Risk" deserves further commentary. The Component Total Risk represents the risk emanating from that specific position considering the portfolio context. A positive value means the position adds to risk. A negative value means the position decreases (i.e. hedges out) risk. The sum of these values is equal to the "Portfolio Total Risk" show in Figure 2.

Portfolio Composition - Long/Short with 14.3% Dividend Yield
-
TickerTrade
Type
Trade Quantity
(# of Shares)
WeightComponent
Total Risk
UnWeighted
Div Yield
Weighted
Div Yield
&CASH  -171677-17.17%0.00%0.00%0.00%
ABTBUY5433.50%0.25%3.17%0.11%
ADBESELL1048-3.50%-0.10%0.00%0.00%
ADSKSELL1101-3.50%-0.03%0.00%0.00%
AEEBUY12263.50%0.36%5.57%0.20%
AEPBUY8533.50%0.38%4.59%0.16%
AIGSELL237-0.78%-0.05%0.00%0.00%
AIVBUY2170.54%0.04%3.10%0.02%
AKAMSELL524-1.88%-0.05%0.00%0.00%
ALXNSELL370-3.50%-0.13%0.00%0.00%
AMDSELL6219-1.21%0.05%0.00%0.00%
AMZNSELL47-1.13%-0.07%0.00%0.00%
ANSELL832-3.50%-0.25%0.00%0.00%
APOLSELL73-0.14%-0.01%0.00%0.00%
AVPBUY24543.50%0.21%5.37%0.19%
BBBYSELL582-3.50%-0.11%0.00%0.00%
BBYBUY29913.50%0.35%5.62%0.20%
BIGSELL775-2.21%-0.12%0.00%0.00%
BIIBSELL234-3.51%-0.20%0.00%0.00%
BMYBUY10733.50%0.30%4.20%0.15%
BRK-BSELL395-3.50%-0.28%0.00%0.00%
BSXSELL6261-3.50%-0.17%0.00%0.00%
BWASELL76-0.50%-0.02%0.00%0.00%
CSELL971-3.50%-0.26%0.11%0.00%
CABUY15843.50%0.07%4.57%0.16%
CAMSELL643-3.50%-0.18%0.00%0.00%
CBGSELL1959-3.50%-0.20%0.00%0.00%
CCISELL518-3.50%-0.25%0.00%0.00%
CELGSELL164-1.29%-0.07%0.00%0.00%
CERNSELL121-0.95%-0.02%0.00%0.00%
CFNSELL1248-3.50%-0.19%0.00%0.00%
CINFBUY8683.50%0.29%4.05%0.14%
CLFBUY11213.50%0.36%6.96%0.24%
CMEBUY6413.50%0.23%4.08%0.14%
CMGSELL98-2.69%-0.06%0.00%0.00%
CMSBUY14883.50%0.35%4.08%0.14%
CNPBUY18173.50%0.36%4.21%0.15%
COPBUY6183.50%0.29%4.66%0.16%
CRMSELL61-0.97%0.01%0.00%0.00%
CTLBUY9093.50%0.27%7.67%0.27%
CTSHSELL395-2.63%-0.07%0.00%0.00%
CTXSSELL259-1.60%-0.01%0.00%0.00%
CVCBUY25043.50%0.44%4.27%0.15%
CVXBUY3323.50%0.30%3.37%0.12%
DBUY6983.50%0.35%4.14%0.14%
DDBUY8123.50%0.24%4.01%0.14%
DFSELL285-0.48%-0.02%0.00%0.00%
DLTRSELL833-3.50%-0.14%0.00%0.00%
DNRSELL2224-3.50%-0.19%0.00%0.00%
DOBUY5203.50%0.26%5.25%0.18%
DOWBUY11913.50%0.28%3.96%0.14%
DPSBUY7813.50%0.21%3.04%0.11%
DRIBUY6543.50%0.25%3.54%0.12%
DTEBUY5943.50%0.36%4.04%0.14%
DUKBUY5793.50%0.36%5.01%0.18%
DVASELL281-3.13%-0.23%0.00%0.00%
EDBUY6473.50%0.35%4.46%0.16%
ELSELL587-3.50%-0.14%0.00%0.00%
EMCSELL1411-3.50%-0.02%0.00%0.00%
ETFCSELL4300-3.50%-0.18%0.00%0.00%
ETRBUY5643.50%0.38%5.33%0.19%
EXCBUY12253.50%0.36%7.28%0.25%
FEBUY8523.50%0.34%5.34%0.19%
FFIVSELL323-2.98%0.03%0.00%0.00%
FISVSELL464-3.50%-0.13%0.00%0.00%
FMCSELL639-3.50%-0.22%0.64%-0.02%
FRXSELL1050-3.50%-0.21%0.00%0.00%
FSLRSELL289-0.71%-0.04%0.00%0.00%
FTISELL838-3.50%-0.21%0.00%0.00%
FTRBUY77953.50%0.43%8.91%0.31%
GASBUY9323.50%0.36%4.88%0.17%
GCIBUY19633.50%0.36%3.87%0.14%
GILDSELL270-2.06%-0.12%0.00%0.00%
GISBUY20.01%0.00%3.14%0.00%
GNWSELL5641-3.19%-0.20%0.00%0.00%
GOOGSELL4-0.27%-0.01%0.00%0.00%
GTSELL2188-2.59%-0.18%0.00%0.00%
HASBUY5612.15%0.12%3.66%0.08%
HCBKBUY42893.50%0.38%3.99%0.14%
HCNBUY5813.50%0.31%4.94%0.17%
HCPBUY7663.50%0.31%4.41%0.15%
HNZBUY5993.50%0.22%3.45%0.12%
HPQBUY28143.50%0.13%4.22%0.15%
HRBBUY19203.50%0.33%4.45%0.16%
HSPSELL815-2.40%-0.13%0.00%0.00%
INTCBUY17753.50%0.13%4.49%0.16%
ISRGSELL12-0.65%-0.04%0.00%0.00%
JDSUSELL2025-2.36%0.00%0.00%0.00%
JNJBUY5033.50%0.28%3.48%0.12%
KBUY6333.50%0.21%3.14%0.11%
KIMBUY18263.50%0.27%4.00%0.14%
KLACBUY7753.50%0.15%3.40%0.12%
KMXSELL32-0.11%-0.01%0.00%0.00%
LEGBUY12763.50%0.31%4.19%0.15%
LHSELL105-0.88%-0.06%0.00%0.00%
LIFESELL699-3.50%-0.21%0.00%0.00%
LLTCBUY3621.18%0.04%3.13%0.04%
LLYBUY7333.50%0.31%4.13%0.14%
LMTBUY3813.50%0.26%4.42%0.15%
LOBUY2843.50%0.19%4.90%0.17%
LRCXSELL990-3.50%-0.09%0.00%0.00%
LSISELL5216-3.50%0.03%0.00%0.00%
LUVSELL2103-1.97%-0.16%0.33%-0.01%
MCDBUY4023.50%0.28%3.26%0.11%
MCHPBUY11673.50%0.15%4.77%0.17%
MNSTSELL402-1.85%-0.02%0.00%0.00%
MOBUY10453.50%0.20%5.08%0.18%
MUSELL6162-3.50%-0.07%0.00%0.00%
MURBUY5993.50%0.35%6.39%0.22%
MYLSELL705-1.91%-0.12%0.00%0.00%
NBRSELL2496-3.50%-0.22%0.00%0.00%
NOCBUY5353.50%0.30%3.31%0.12%
NUBUY9283.50%0.35%3.31%0.12%
NUEBUY8513.50%0.30%3.59%0.13%
NYXBUY15303.50%0.30%5.28%0.18%
OISELL1769-3.50%-0.22%0.00%0.00%
PAYXBUY10793.50%0.28%4.01%0.14%
PBCTBUY29413.50%0.32%5.46%0.19%
PBIBUY31333.50%0.24%13.43%0.47%
PCARBUY1260.54%0.04%3.48%0.02%
PCGBUY8713.50%0.35%4.54%0.16%
PCLBUY8333.50%0.30%4.02%0.14%
PCLNSELL21-1.35%-0.05%0.00%0.00%
PCPSELL195-3.50%-0.27%0.07%0.00%
PEGBUY11973.50%0.36%4.79%0.17%
PEPBUY890.62%0.04%3.04%0.02%
PFEBUY14273.50%0.28%3.61%0.13%
PHMSELL2055-3.50%-0.22%0.00%0.00%
PLDBUY3831.31%0.09%3.30%0.04%
PMBUY3873.50%0.19%3.56%0.12%
PNWBUY7103.50%0.35%4.28%0.15%
POMBUY18323.50%0.37%5.66%0.20%
PPLBUY12463.50%0.35%5.07%0.18%
PXDSELL324-3.50%-0.18%0.08%0.00%
RAIBUY8123.50%0.22%5.40%0.19%
RDCSELL451-1.49%-0.09%0.00%0.00%
RHTSELL267-1.33%0.00%0.00%0.00%
RRDBUY36733.50%0.38%10.91%0.38%
SCGBUY7763.50%0.35%4.35%0.15%
SEBUY12463.50%0.35%4.11%0.14%
SNDKSELL174-0.70%-0.04%0.00%0.00%
SOBUY8333.50%0.35%4.60%0.16%
SPLSBUY28883.44%0.24%3.64%0.13%
SRCLSELL380-3.50%-0.25%0.00%0.00%
STXBUY12183.33%0.12%4.26%0.14%
STZSELL30-0.10%-0.01%0.00%0.00%
SWYBUY20643.50%0.28%3.89%0.14%
SYYBUY11293.50%0.29%3.54%0.12%
TBUY10193.50%0.28%5.20%0.18%
TEBUY21593.50%0.37%5.40%0.19%
TEGBUY6653.50%0.36%5.17%0.18%
TERSELL2197-3.50%-0.05%0.00%0.00%
TSOSELL299-1.25%-0.07%0.29%0.00%
TYCSELL1265-3.50%-0.21%0.00%0.00%
URBNSELL444-1.68%-0.09%0.00%0.00%
VARSELL79-0.55%-0.04%0.00%0.00%
VMCSELL432-2.13%-0.15%0.08%0.00%
VNOBUY13753.50%0.26%3.69%0.13%
VTRBUY5383.50%0.30%3.79%0.13%
VZBUY8003.50%0.32%4.67%0.16%
WATSELL418-3.50%-0.06%0.00%0.00%
WINBUY42073.50%0.32%12.02%0.42%
WMBUY10823.50%0.27%4.38%0.15%
WMBBUY10473.50%0.26%3.89%0.14%
WPISELL407-3.50%-0.22%0.00%0.00%
WPXSELL2116-3.50%-0.24%0.00%0.00%
WYNNSELL82-0.90%-0.06%0.00%0.00%
XELBUY13453.50%0.36%4.06%0.14%
XLNXBUY10243.50%0.12%2.52%0.09%
       
       
TOTAL:  100.00%16.61% 14.32%
9 Comments

Predicting S&P 500 Returns using "Recession" News

11/10/2012

1 Comment

 
The last two blog posts focused on quantifying news stories to shed light on Earnings news and M&A news. Today, we'll carry on with this theme to look at "Recession" news. Again, the idea here is to collect news articles on S&P 500 stocks and then compute the percentage of that overall news flow that has to do with "recessions".  

The charts below plot recession news (see top chart) and the SPY ETF (i.e. S&P 500 ETF) on the lower chart. 
News articles for S&P 500 stocks: Recession News
(percent of overall news flow)
vs.
SPY (S&P 500 ETF)
Recession News
The most salient point we can deduce from these graphs is that recession news spiked in Aug 2011 to around 0.35% of the overall news flow. This massive spike corresponded to the sharp market sell-off. Then, as recession fears mitigated, recession news flow dissipated, and the market began it's 2012 rally. 

As investors, we have some obvious questions about this metric: 
  • Does it have predictive value?
  • Does the market follow the news or does the news follow the market? 
I don't have a long enough data history to render a definitive conclusion. What's clear however is that news chatter around "recession" certainly doesn't help the market. 

Looking at the more recent data, it appears that recession news is nearing a post spike low. This seemingly should bode well for the market going forward. 
1 Comment

Mergers and Acquisitions - What's the news saying?

11/9/2012

1 Comment

 
Apropos of my previous blog post discussing quantifying news stories, I present an additional news metric that provides food for thought.

The graph below represents M&A news chatter activity through time, with the Y-axis representing M&A news as a percentage of the overall news flow. The graph shows that M&A news peaked in Q1/Q2 2011 (at around 1.3%) and has been declining ever since.
News articles for S&P 500 stocks: M&A News 
(percent of overall news flow)
Mergers and Acquisitions News
1 Comment
<<Previous

    Author

    Jason Apolee is a contributing editor to The Margin Investor where he focuses on news commentary and evaluating broker offerings.

    RSS Feed

    Archives

    November 2013
    February 2013
    January 2013
    November 2012
    July 2012
    May 2012
    January 2012
    December 2011
    November 2011

    Categories

    All
    Academic Papers
    Bonds
    Brokers
    Buy-write
    Capital Gains
    Covered Call
    Discount Brokers
    Dividend Yield
    Earnings
    Financial Crises 2008
    Hedging
    High Yield
    Indexes
    Leverage
    M&A
    Margin Rates
    News Info
    Portfolio Risk
    Recession
    Stock Concentration
    Strategy Based Margin
    Systematic Margin Risk
    Taxes
    Trading
    Trading Strategies
    Videos

Copyright © The Margin Investor 2015